
What happened
On 29 January 2026, CDC’s National Center for Health Statistics published final 2024 mortality. Life expectancy at birth for the U.S. population was 79.0 years, up 0.6 year from 78.4 in 2023. That is the highest figure NCHS has recorded. The age-adjusted death rate fell 3.8%, from 750.5 deaths per 100,000 in 2023 to 722.1 in 2024. There were 3,072,666 resident deaths, 18,298 fewer than in 2023.
A one-year jump is easy to misread. The useful picture is the line.
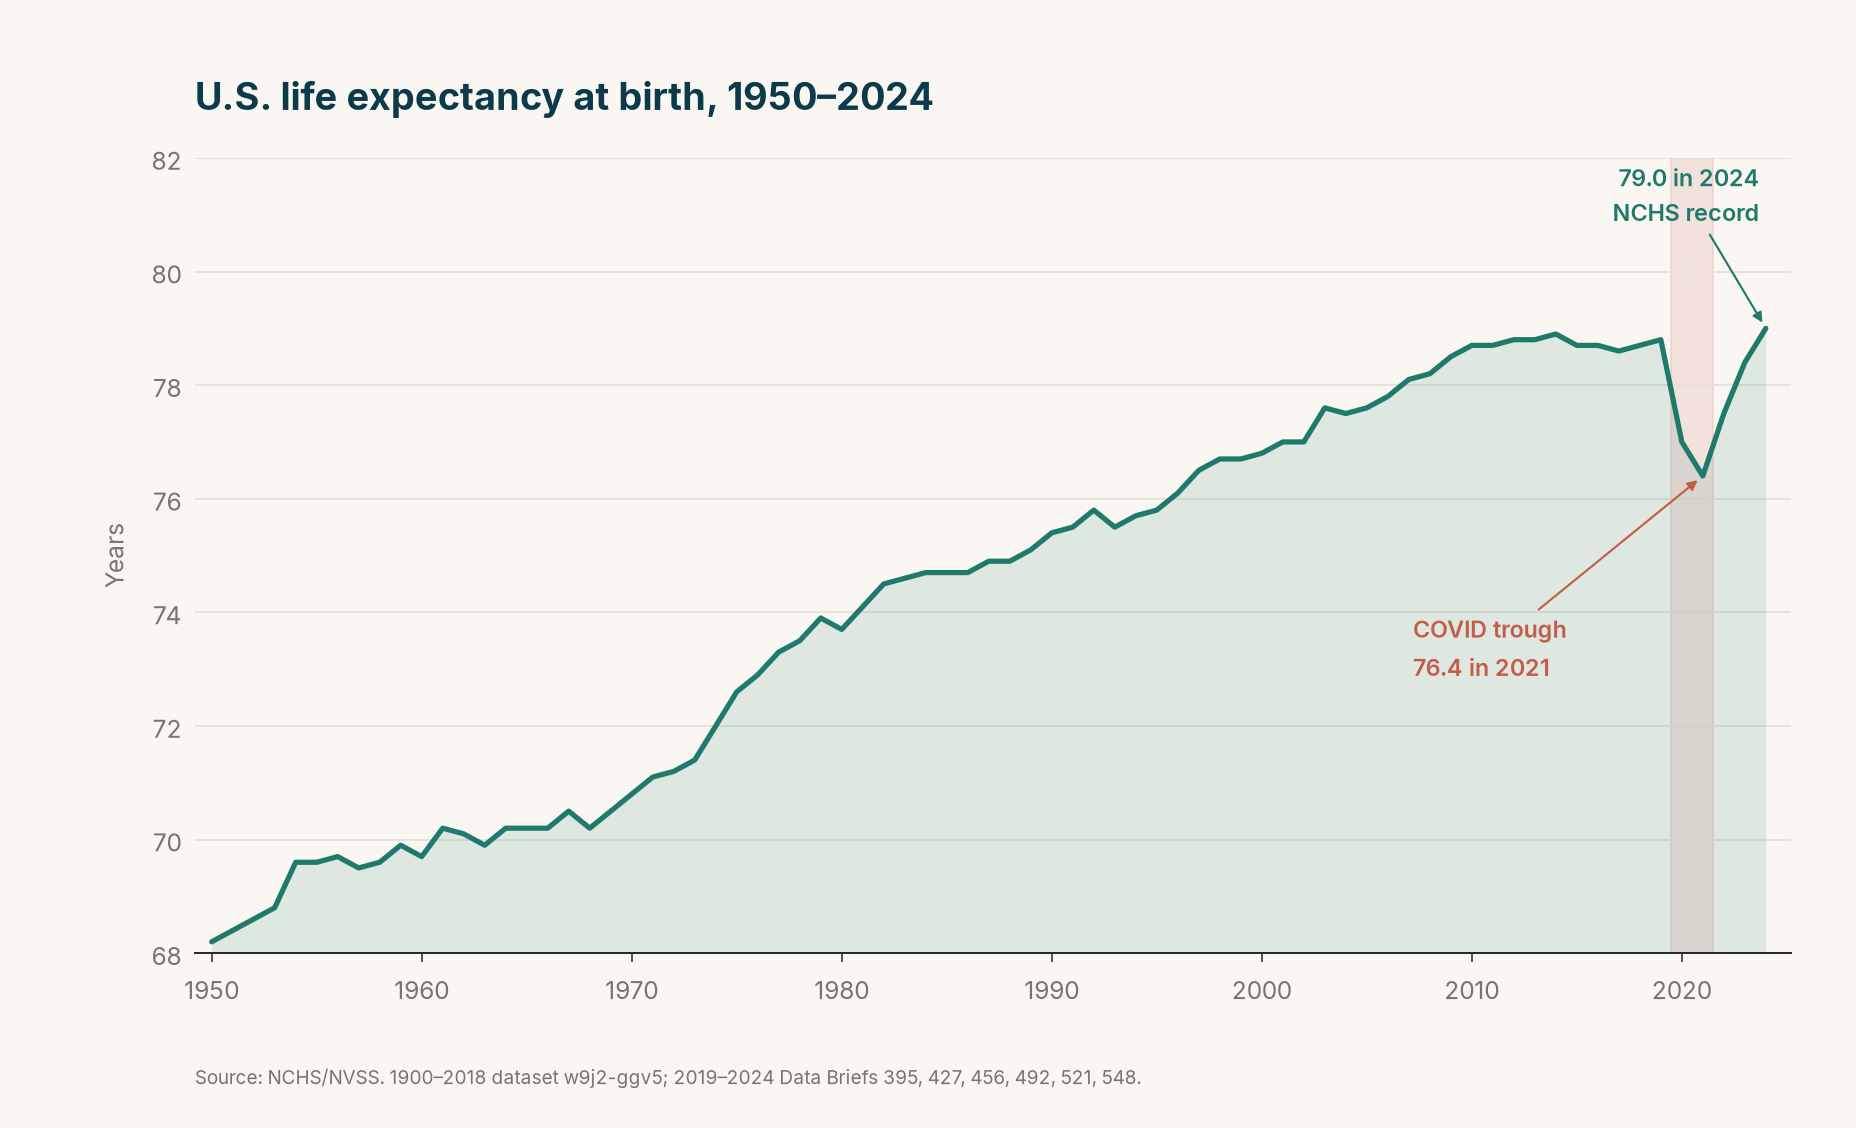
Life expectancy at birth, both sexes. NCHS / NVSS. The 1900–2018 values are the public NCHS file (dataset w9j2-ggv5). 2019–2024 are the annual Data Briefs (395, 427, 456, 492, 521, 548).
From 1950 (68.2 years) the line climbs for decades, flattens in the 2010s, then drops. 2014 was 78.9. 2018 was 78.7. 2019 recovered one tenth, to 78.8. Then COVID: 77.0 in 2020, 76.4 in 2021, the lowest in a generation. 2022 (77.5) and 2023 (78.4) were the climb back. 2024 is the first year NCHS has printed a 79.
It is not a projection. It is not “back to normal” in a vague sense. It is the first time the official period life table has cleared the pre-pandemic peak.
Men closed more of the gap than women
Females reached 81.4 years in 2024, up 0.3 from 81.1. Males reached 76.5, up 0.7 from 75.8. The female–male gap is 4.9 years, down 0.4 from 2023.
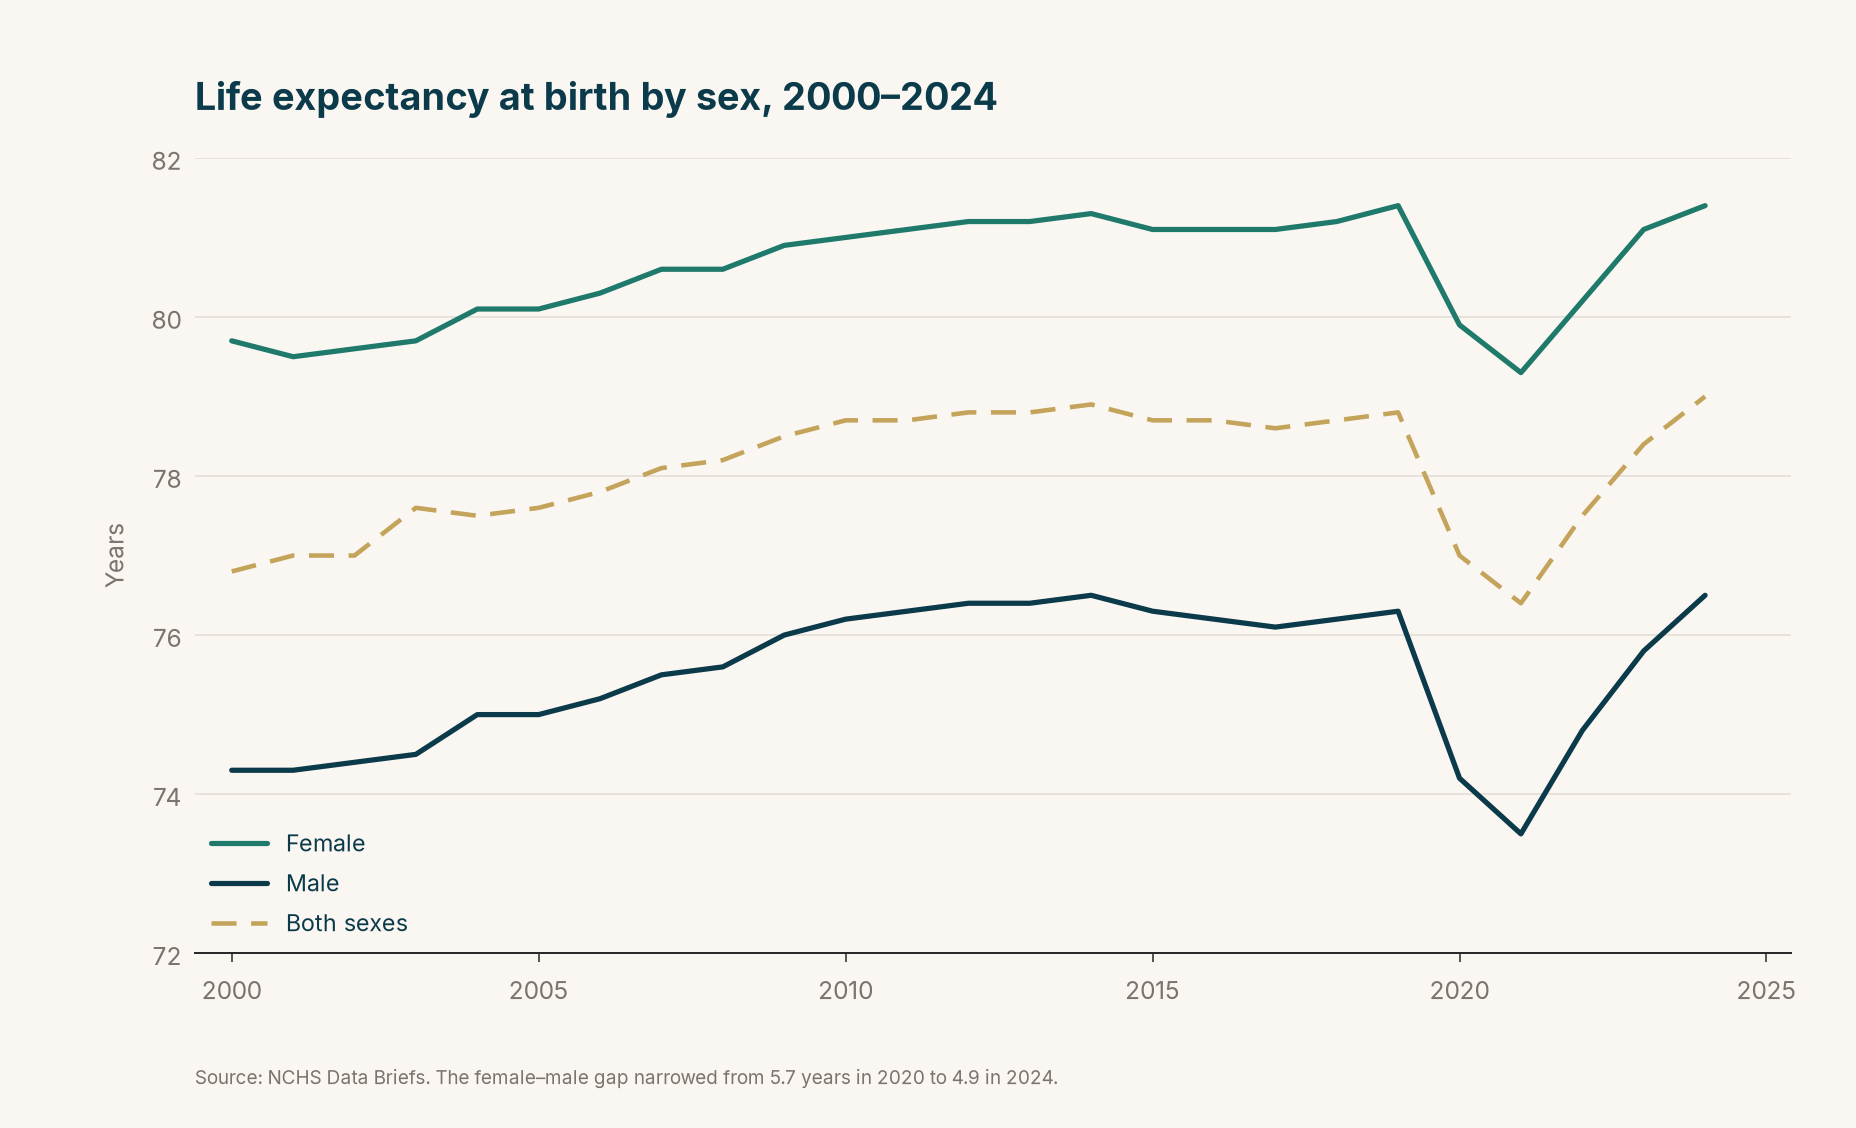
NCHS Data Briefs. The 2020 gap was 5.7 years (74.2 vs 79.9). Males fell further in the pandemic years and have been recovering faster.
At age 65, remaining life expectancy was 19.7 years in 2024 (20.8 for women, 18.4 for men). That is a 0.2-year gain at 65 for the total population. The recovery is not only among the young.
The death rate is the other way to see the same fact
Life expectancy is a summary of the entire age schedule of mortality. The age-adjusted death rate is the blunt instrument: deaths per 100,000, stripped of the fact that the population is older than it was in 2000.
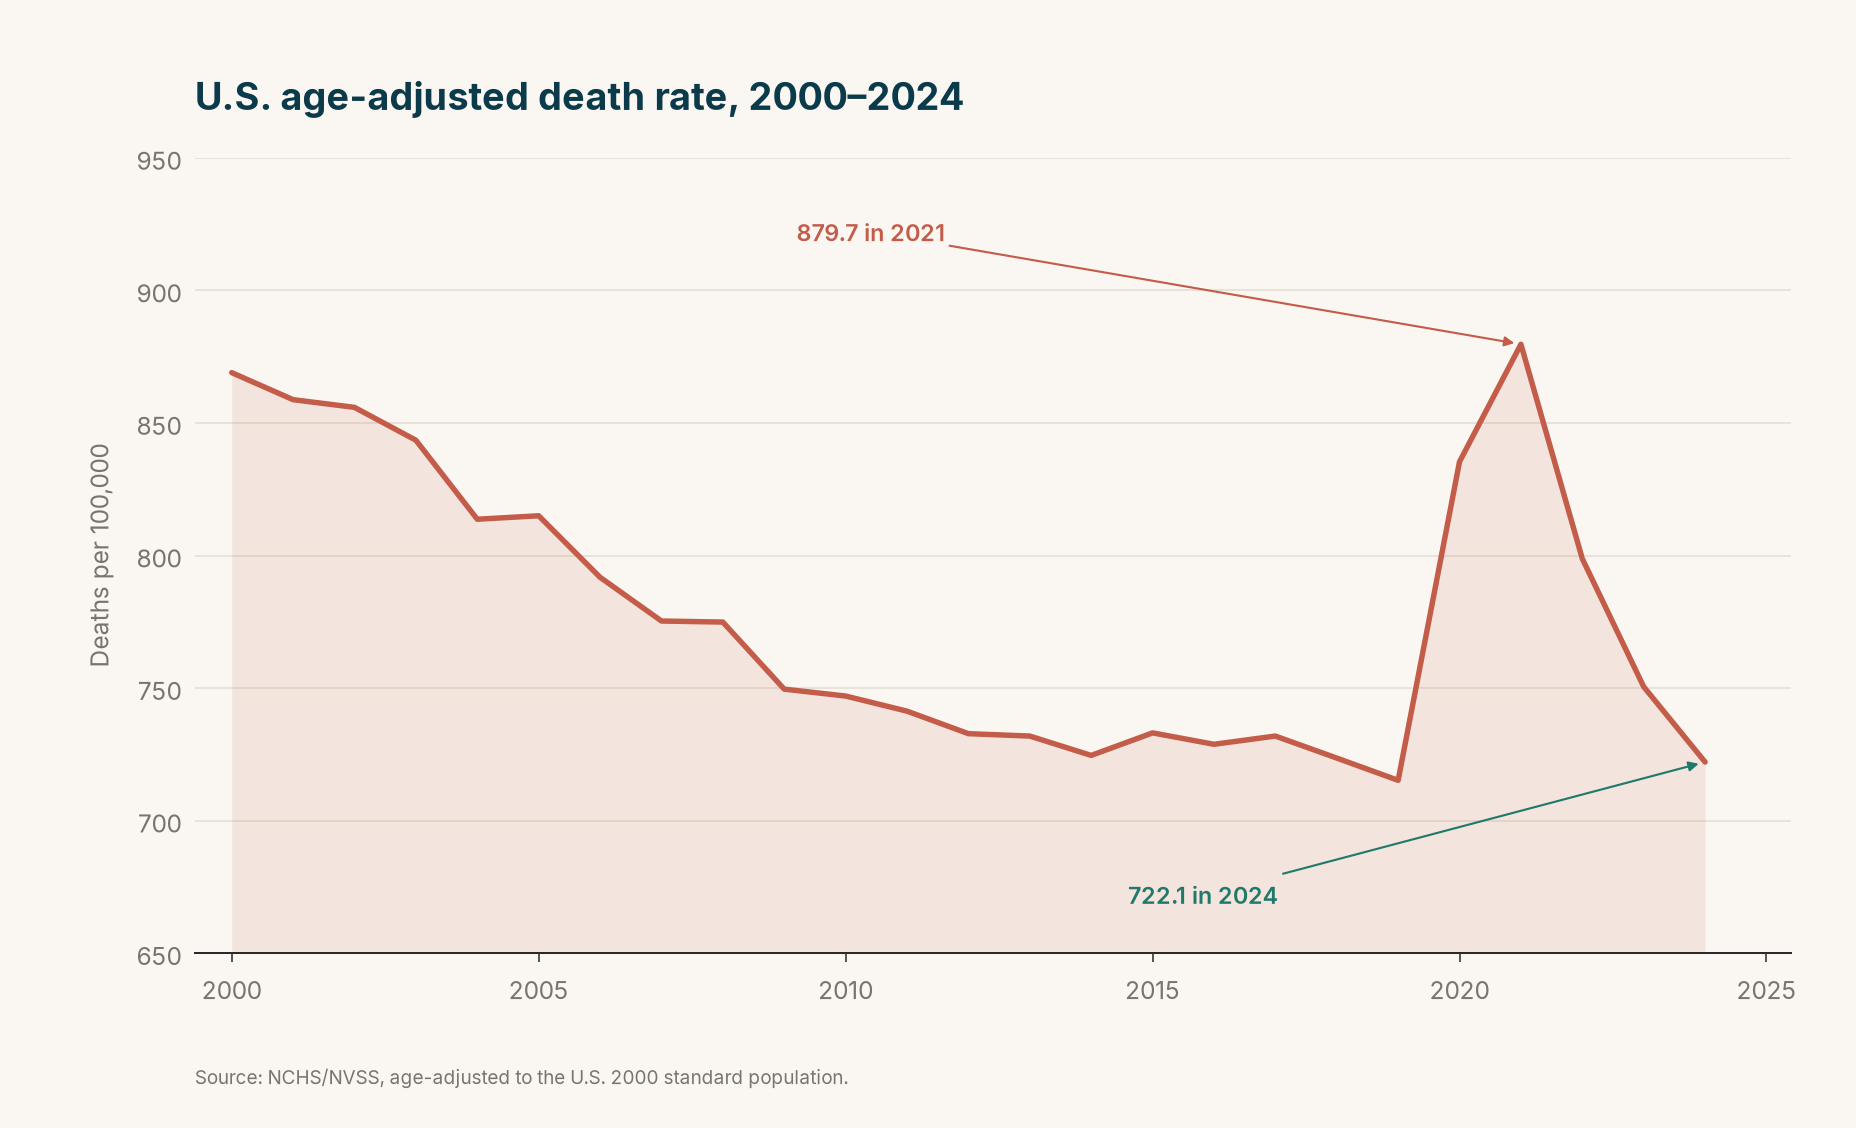
Deaths per 100,000 U.S. standard population. 2019: 715.2. 2020: 835.4 (+16.8%). 2021: 879.7. 2022: 798.8. 2023: 750.5. 2024: 722.1.
2024’s 722.1 is close to the 2018 rate (723.6) and still a little above 2019 (715.2). The record life expectancy and a death rate that has not quite recaptured 2019 can sit together: the age structure moved, and so did the mix of causes.
Provisional 2025 data, published separately as VSRR 44 on 2 July 2026, put the age-adjusted rate at 689.2, 4.6% below 2024. That file is not a life table. Do not read it as “life expectancy rose again.” It is the next death-rate print, covering 3,094,593 deaths and 99.9% of certificates as of 10 May 2026.
Who actually died less in 2024
Age-specific rates fell for every group aged 1 and older except 5–14, which was statistically unchanged (14.7 to 14.5). The largest proportional drops were in the working-age bands that carried so much of the pandemic and overdose years: 15–24 down 12.9% (76.8 to 66.9), 25–34 down 15.9% (148.1 to 124.5), 35–44 down 9.9% (237.3 to 213.9).
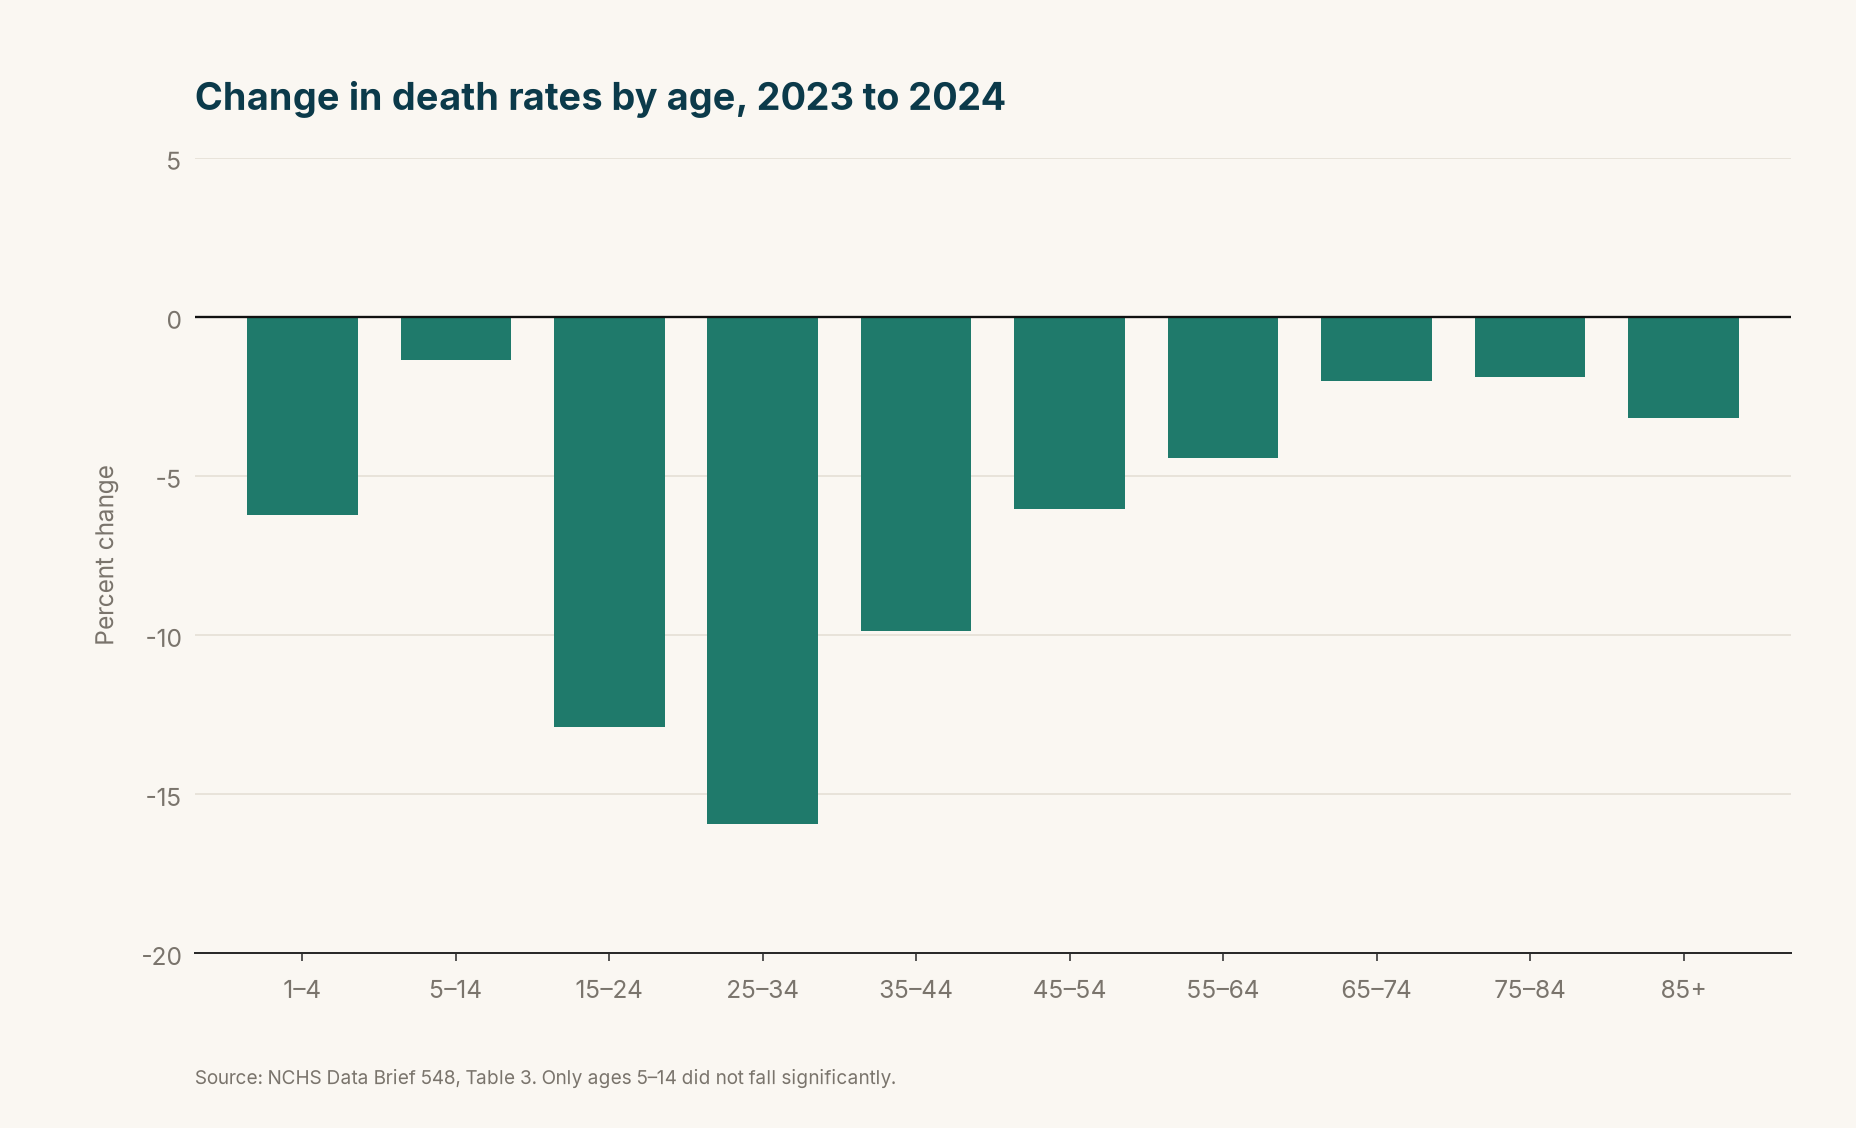
Percent change, Data Brief 548 Table 3. Infant mortality is separate: 560.2 to 552.5 deaths per 100,000 live births, not a significant change. SIDS, one leading cause of infant death, did fall 7.5%.
NCHS says the 0.6-year rise in life expectancy came largely from fewer deaths due to unintentional injuries, COVID-19, heart disease, cancer, and homicide. COVID-19 dropped out of the ten leading causes (31,426 underlying-cause deaths, down 37.1% from 49,932) and is now 15th. Suicide entered the list as tenth.
Heart disease, cancer, and unintentional injuries remained 1–2–3. The 10 leading causes accounted for 70.9% of deaths.
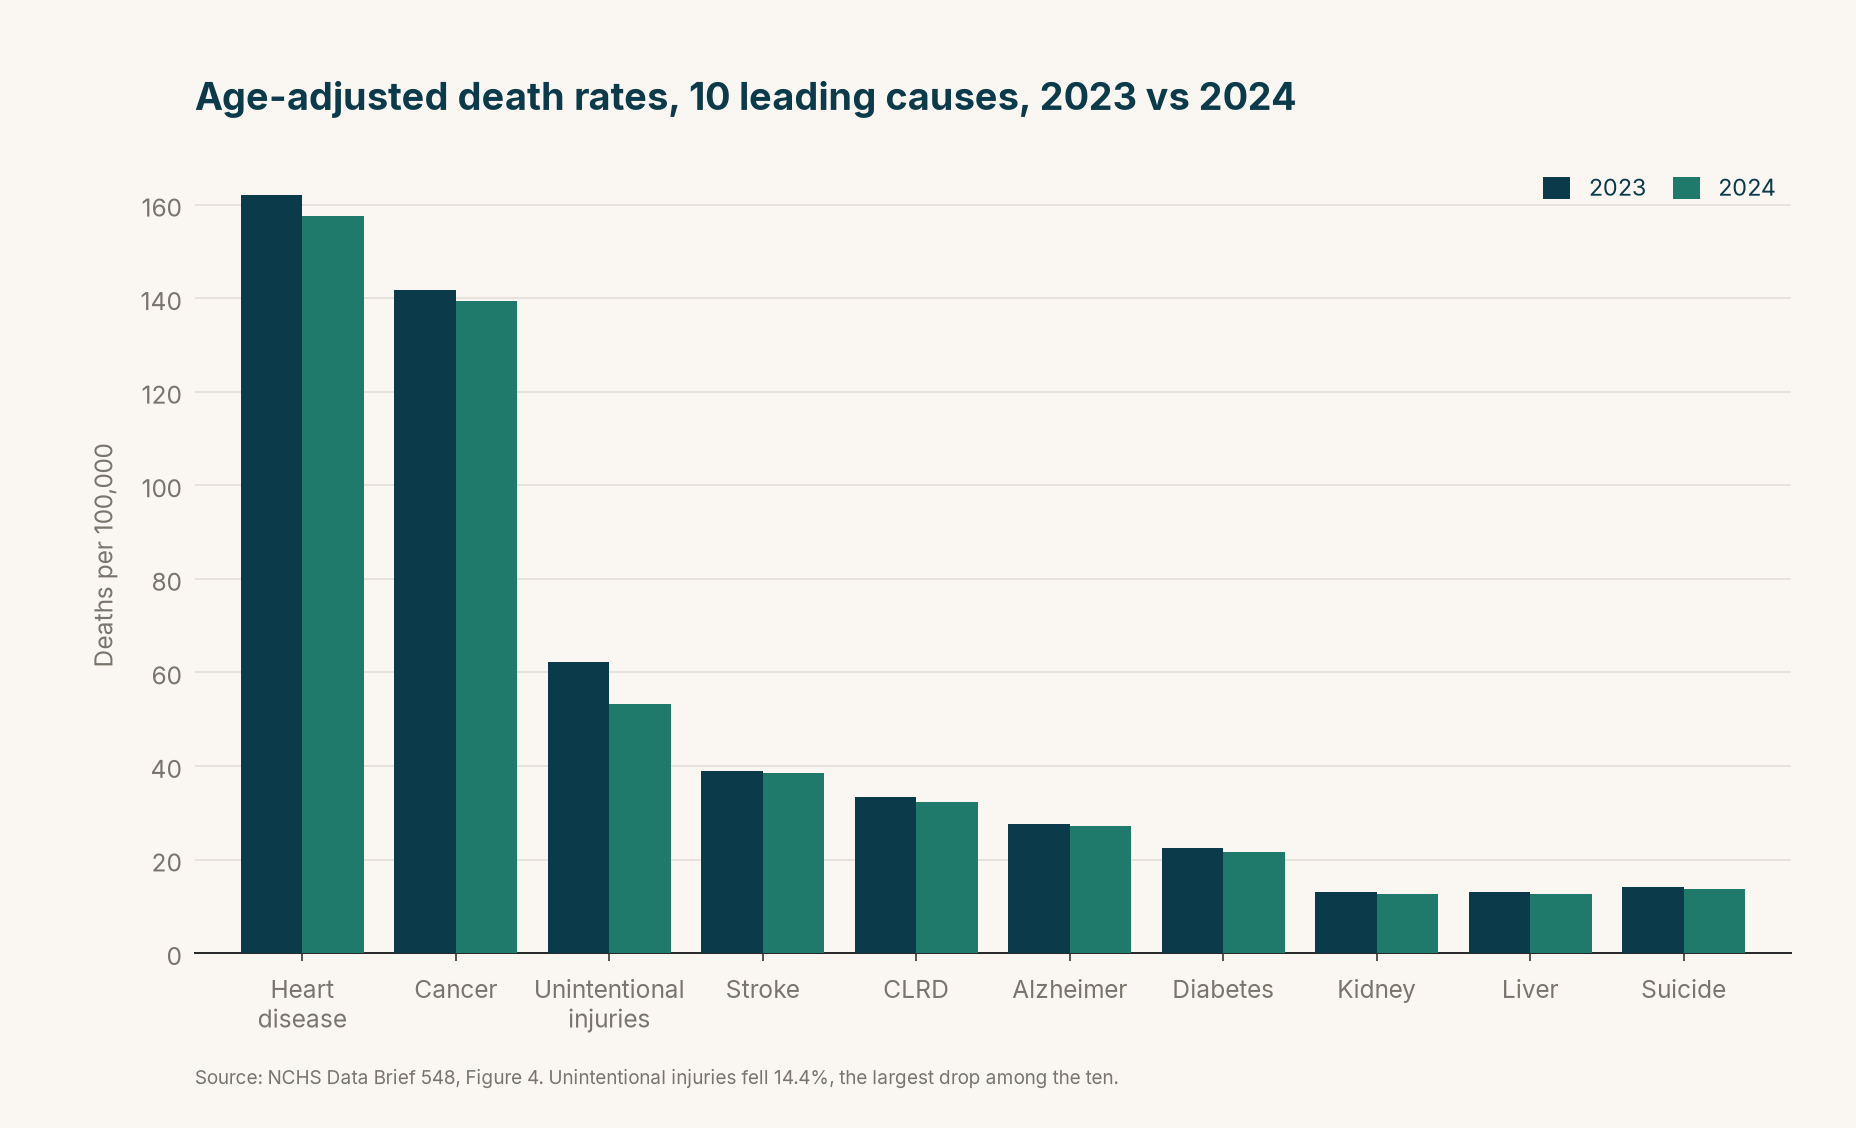
Data Brief 548 Figure 4. Every one of the ten rates fell. Unintentional injuries fell 14.4% (62.3 to 53.3), the largest drop. Heart disease’s rate fell 2.8% even though the raw count rose, from 680,981 to 683,491. Cancer’s count also rose, 613,352 to 619,876, while its rate fell 1.7%.
That last distinction matters. More people can die of heart disease in a larger, older population while the age-adjusted rate still improves. The progress is real. It is not a claim that fewer Americans had heart attacks.
Rates fell for every listed race and Hispanic-origin group, females and males, after NCHS’s correction for death-certificate misclassification. The levels are not equal. In 2024 the corrected age-adjusted rate for non-Hispanic Black males was 1,094.9; for non-Hispanic Asian females, 317.6; for Hispanic females, 454.6; for non-Hispanic White females, 646.6. A falling line in every group is not a closed gap.
The overdose report is a second document
The same day, NCHS released “Drug Overdose Deaths in the United States, 2023–2024.” The overdose death rate fell 26.2%, from 31.3 to 23.1 per 100,000, the largest decline on record. 79,384 residents died of drug overdose in 2024. Deaths involving synthetic opioids other than methadone (including fentanyl) fell 35.6%, from 22.2 to 14.3 per 100,000. Cocaine-involved deaths fell 26.7% (8.6 to 6.3); psychostimulants including methamphetamine fell 19.8% (10.6 to 8.5).
That is not a paraphrase of Data Brief 548. Unintentional injuries in the life-expectancy report include overdoses plus crashes, falls, and the rest. The dedicated overdose file is the one to quote for fentanyl.
79,384 is still tens of thousands of deaths. The curve bent. It did not vanish.
Why it matters
For a decade the U.S. was the rich country whose life expectancy had stalled, then the country that lost almost two years in the pandemic. 79.0 is the first official print above that stall. The death-rate chart shows the same recovery and shows that 2019 has not been fully recaptured. The age chart shows the gain is concentrated where overdose and COVID hit hardest. The cause chart shows injuries moving, heart disease and cancer barely moving, COVID leaving the top ten.
This is a statistical turning point with remaining gaps, not a victory lap. Peer countries are still ahead. Infant mortality did not improve. Ages 5–14 did not improve. Suicide is now a leading-cause line.
Related reading: US death rate fell to a recorded low in 2025. NCHS VSRR 44 puts the provisional 2025 age-adjusted death rate at 689.2 per 100,000, below the final 2024 rate of 722.1. That file is a death-rate print, not a 2025 life table.
What to watch next
Provisional 2025 mortality (VSRR 44) already reports a lower age-adjusted death rate. The open question is the 2025 life table, which NCHS has not published. Whether the fentanyl-involved rate keeps falling, or 2024 was a one-year drop. Whether influenza and pneumonia, which rose in the 2025 provisional ranking, stay there. And whether the 5–14 stall and the flat infant rate are noise.
The primary sources are the Data Brief, the overdose report, and the 1900–2018 NCHS file, not a press-conference mood.
Related reading: Burkina Faso’s malaria vaccine cut cases by a third — another public-health statistic with a hard national number, from WHO’s 24 August 2026 briefing and Burkina Faso’s 2024–2025 case counts.
Sources
- NCHS press release, 29 January 2026
- NCHS Data Brief 548, Mortality in the United States, 2024
- Data Brief 548 PDF
- Data Brief 521 (2023)
- Data Brief 492 (2022)
- Data Brief 456 (2021)
- Data Brief 427 (2020)
- Data Brief 395 (2019)
- NCHS life expectancy / death-rate file, 1900–2018
- VSRR 44, provisional mortality 2025