
NASA’s Jet Propulsion Laboratory has a simple 2025 number that is easy to misuse: the ocean went up less than a millimetre. That is a climate-cycle wiggle, not a turning point. The same analysis says the three-decade trend has more than doubled, and that the pause in the annual increment should reverse as land-stored water drains back to the sea.
What happened
On 29 January 2026 NASA posted Photojournal item PIA26619, “NASA Analysis Shows La Niña Limited Sea Level Rise in 2025.” Researchers at JPL, using the continuous satellite altimetry record that began with the U.S.–French TOPEX/Poseidon mission in 1992 and now runs through Sentinel-6 Michael Freilich (launched November 2020), found:
| Year / reference | Global mean sea-level change | Source |
|---|---|---|
| 2025 | 0.03 inches (0.08 cm) | NASA PIA26619, 29 Jan 2026 |
| 2024 | 0.23 inches (0.59 cm) | same |
| Long-term expected rate (early 1990s onward) | 0.17 inches (0.44 cm) per year | same |
| Three-decade trajectory | has more than doubled | same (solid red line on the graph) |
2025 therefore came in below both the previous year and the multi-decadal average. NASA’s explanation is the La Niña that began in 2025 and continued into early 2026. Even though this event was relatively mild, extra rainfall over the Amazon basin moved water from ocean to land and offset part of the rise that would otherwise have come from melting land ice and from thermal expansion of a warming ocean.
That mechanism is not a new idea. Years in which the annual increment is unusually small have usually been La Niña years: the cool phase of the El Niño–Southern Oscillation often loads rain onto equatorial South America. What is new is the tightness of the observing system. A 0.08 cm residual is knowable only because overlapping altimeters have been flying, with a designated reference mission, for more than thirty years.
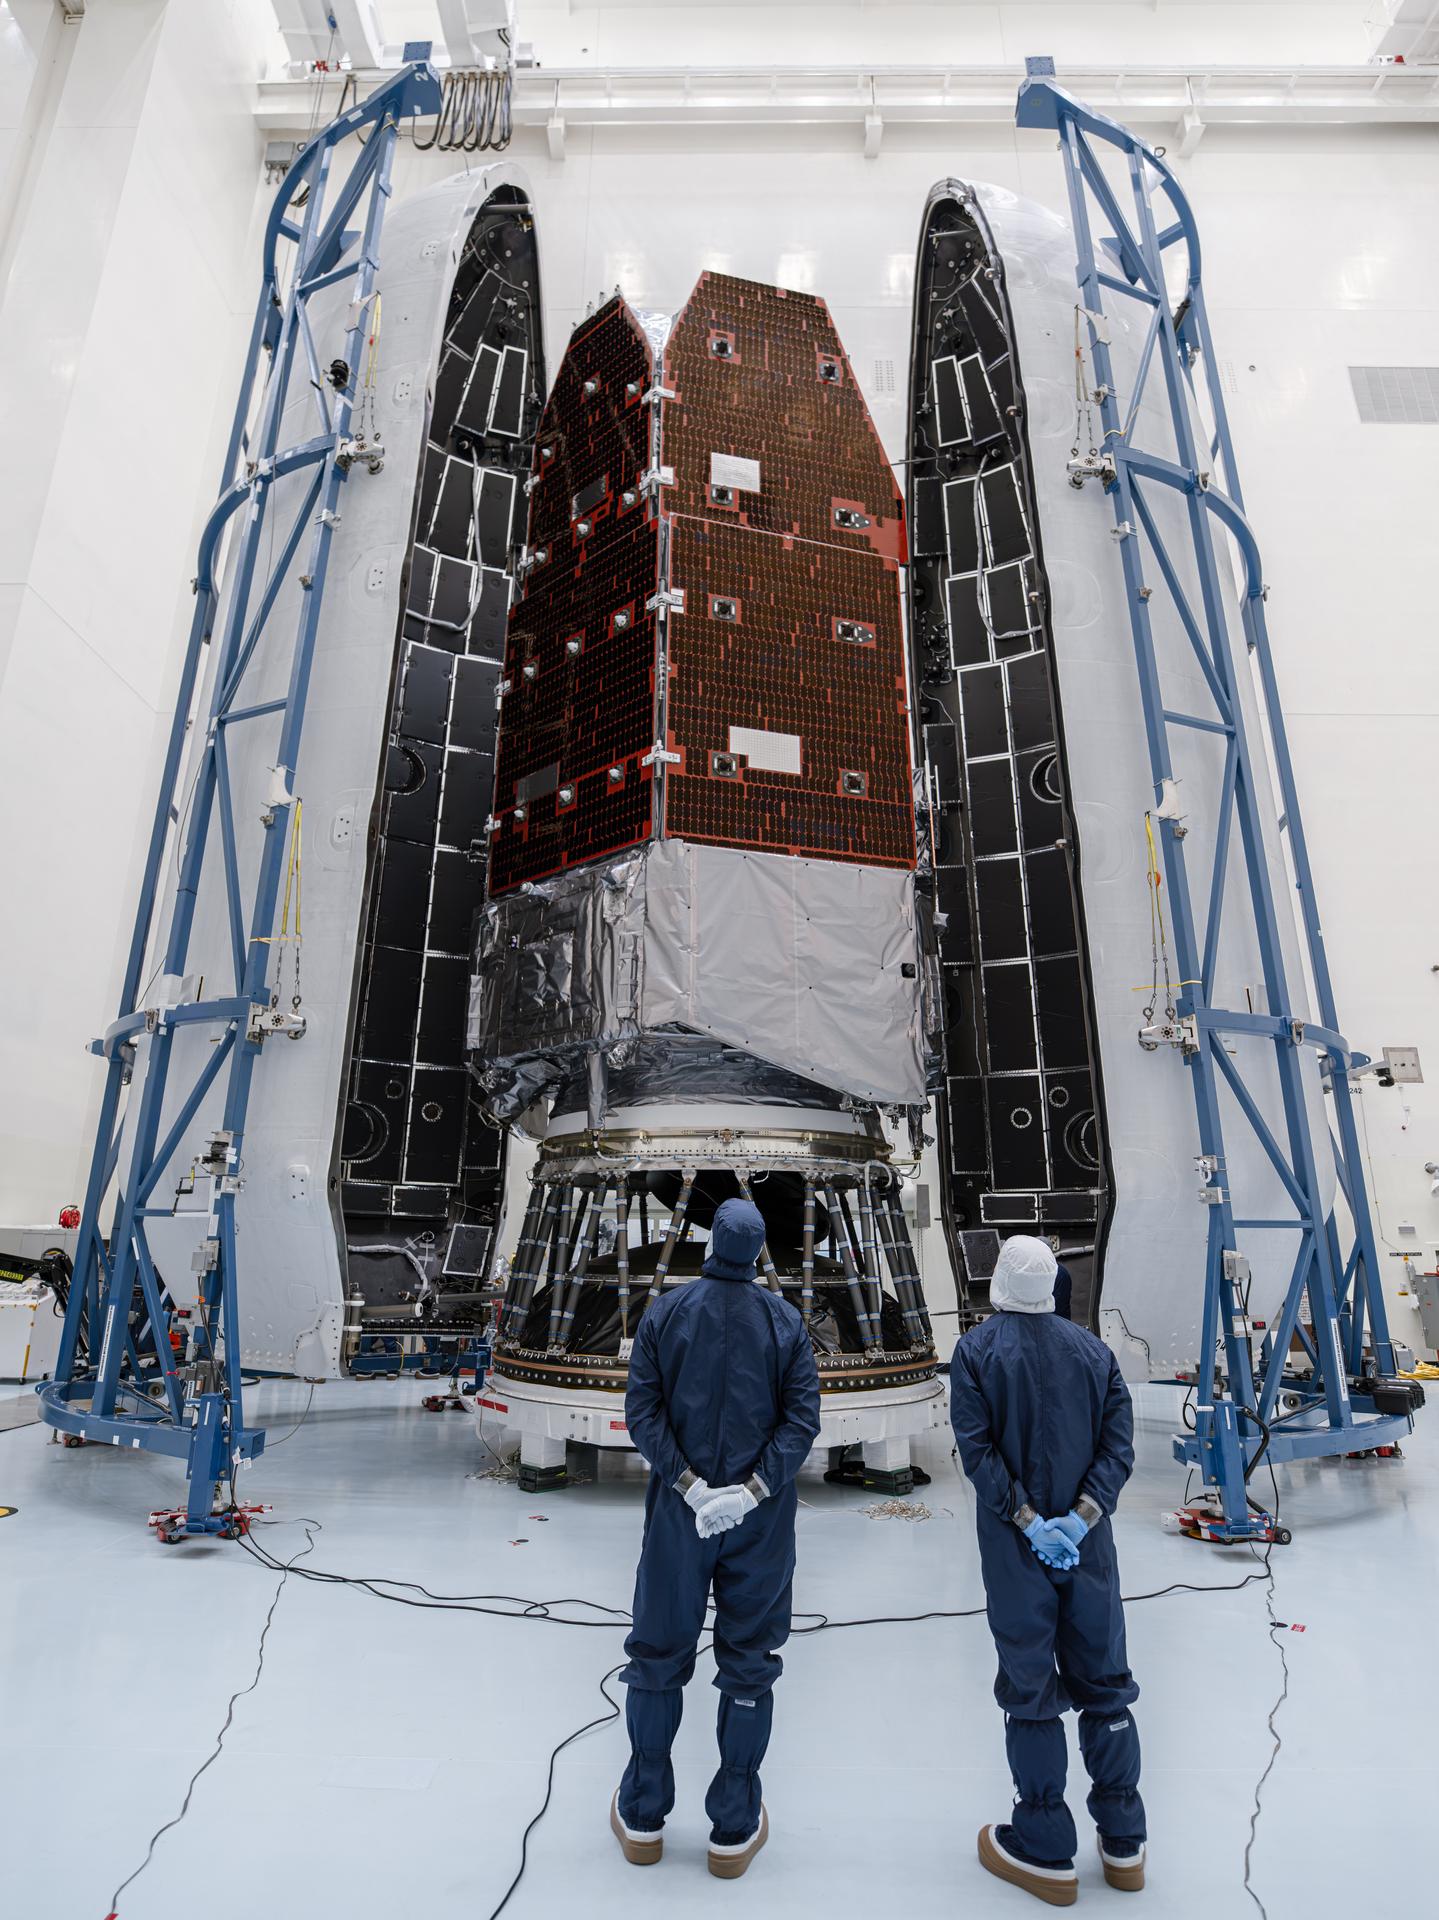
Sentinel-6B, launched in November 2025, is in a cross-calibration period and will take over as the reference altimeter from Sentinel-6 Michael Freilich. Continuity of that reference series is how a sub-millimetre annual change is even a published number rather than noise.
NOAA’s ENSO education pages remain the right primer for the cycle itself: El Niño and La Niña are Pacific temperature patterns, not a verdict on whether the ocean is still warming. JPL’s sea-level page for TOPEX/Poseidon records the start of the modern altimetry era; the Sentinel-6 Michael Freilich mission page records who holds the reference today.
Why it matters
Year-to-year sea-level “wiggles” are how the water cycle shows up on top of the secular trend. A La Niña year that parks rain on tropical land is a known, temporary subtraction. Seeing it at 0.08 cm, and being able to name the basin, is a measurement result: thirty-plus years of overlapping altimeters, not a policy verdict.
Two misreadings are already in circulation whenever this chart is posted, and both should be refused on sight.
- “Sea-level rise is stopping.” It is not. NASA’s own graph (1993–2025) shows a trajectory that has steepened. The agency says faster rise is likely to resume as Amazon-basin water returns to the ocean.
- “0.08 cm means the satellites are noisy.” The opposite: the record is now tight enough to resolve a sub-millimetre annual residual and attribute it to ENSO.
For a Good Signal reader, the progress is the observing system — TOPEX through Jason to Sentinel-6 — and the discipline to separate oscillation from trend. The climate problem underneath the wiggle is unchanged. Thermal expansion and melting land ice are still adding volume. A mild La Niña moved some of that water onto the Amazon for a year. It did not cancel the sources.
What to watch next
- 2026 increment. If La Niña fades and the Amazon anomaly drains, the annual rise should move back toward (or above) the 0.44 cm/year reference rate. That would confirm NASA’s own “faster-rising sea levels are likely to resume” line.
- Sentinel-6B handover. After cross-calibration, it becomes the reference mission. Any 2026–27 analysis should say which satellite is the standard.
- Ice vs. water-cycle split. The useful next product is how much of a given year is land-water storage versus ice-mass loss versus thermal expansion — the same satellite series, sliced by process, not just the global mean.
Sources
- NASA Science Photojournal PIA26619, “NASA Analysis Shows La Niña Limited Sea Level Rise in 2025,” 29 January 2026 — https://science.nasa.gov/photojournal/nasa-analysis-shows-la-nina-limited-sea-level-rise-in-2025/
- NASA Photojournal JPEG (public domain) — https://photojournal.jpl.nasa.gov/jpeg/PIA26619.jpg
- NASA/JPL, TOPEX/Poseidon mission summary — https://sealevel.jpl.nasa.gov/missions/topex-poseidon/summary/
- NASA/JPL, Sentinel-6 Michael Freilich mission summary — https://sealevel.jpl.nasa.gov/missions/jason-cs-sentinel-6/summary/
- NOAA, El Niño / La Niña education collection — https://www.noaa.gov/education/resource-collections/weather-atmosphere/el-nino